
DOT coin and LINK having similar price action and it has been seen that both of these coins follow each other. The chart of both of these coins has quite a lot of similarities. It has been generally seen that the timing of rallying and dropping is quite similar.
DOT is one of the most promising coins currently being traded in the market. The value that it is bringing to the crypto market is a lot and it has been recognized by the community and the investors.
It is to be understood that the market is really volatile, even when the conditions aren’t like what they are now. So even the best projects suffer from bearish sentiments and it is expected for them to do so.
DOT Coin – Technical Analysis
Three possible scenarios can play out currently. It is to notice that every day new developments come out and it is a possibility that the chart that is valid today to some extent isn’t valid tomorrow. Always trade what the chart shows and keep your sentiments aside.
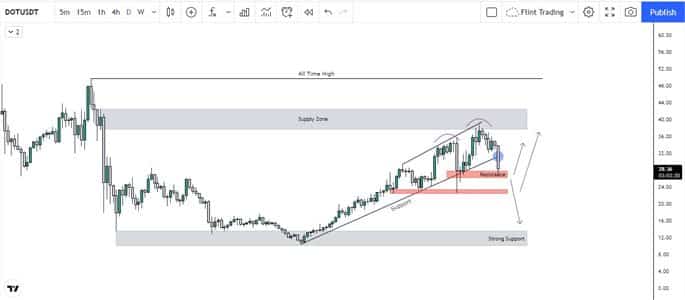
The daily close and the candles in the next few days can give us a better insight about how the price might pay out in the later stages. Two zones have been marked as shown in the chart. These are the formations of order blocks. It has been seen that the market comes back to the order block placements and if it holds it bounces back from there. As it can be seen that DOT bounced back thrice from the first one and nearly twice from the second one. If this candle holds above this zone, it can be expected of the price to move back up. If it doesn’t then the price may come down to touch the second zone. Clearly, the price has broken below the trend line which is a confluence towards the bearish side but the candle hasn’t closed yet. If in the case that the second order block is also broken then it can b expected of the price to touch the bottom again (the bottom when Btc crashed and DOT touched a near price of $10.
Levels to Watch
$11 is strong support all the way to the bottom (let’s hope it doesn’t go down that much). A supply zone around $40 is a strong resistance for the coin atm. At the moment relief can be expected from the marked zone.
At the time of writing DOT is being traded at a price of $29.88 with an increase of 5.55% in the last 24 hours but an overall decrease of 4.53% in the whole month.