FET is currently being traded at the rate of $0.662 with a decrease of 12.97% within the last 24 hours.
FET being Bullish made its all-time high when BTC was struggling to get back on track. just a few days before, on 8th September, the market wicked in and reached $1.1965 making the high of this coin.
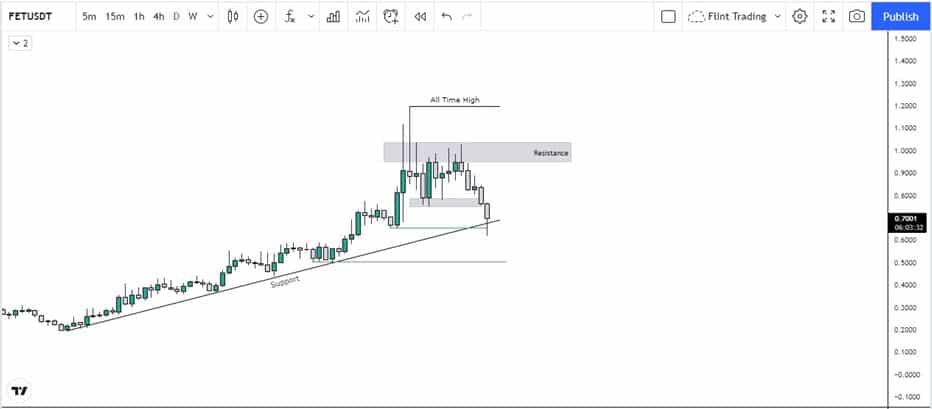
Now much bullish momentum was needed to break the previous high and make a new one. now the bulls seems to have been exhausted which resulted in distribution in price. The price currently was being in consolidation and making support and resistances, inducing both early sellers and buyers, and very likely it will take both out. the market broke below $0.7703 which was the most recent support after the all time high.
Now talking about supports, the areas of $0.6990 and $0.5034 are very strong ones, as they align with Fibo levels, a market previously reacted from them and they are structural higher lows.
So these levels will very likely play an important role in supporting the price to the upside. now the price action is also very favorable to the downside, as the price is having some huge institutional footprints, while bearish on the support clearly tells, that sellers are in control.
It shouldn’t be forgotten that BTC also has a very huge confluence on alts, and as BTC is bearish, this gives a sign of all alts including FET to continue bearish.
Trend line, S & R
The near resistances are around $0.6964 to $1.0349 and the extreme one is definitely the all time high which is $1.1965.
As the chart shows the price has broken down from an important support level by the current running candle (at the time of writing this article). A daily close would provide us a better look at how the price unfolds in the near future. Notice that the coin is at the verge of breaking the trend line (Again a daily close will provide us a clearer outlook). If a bounce occurs we can hope to see the price rally again (as long as BTC doesn’t messes). Since this trend line is acting as a support for the coin, in case the line is broken we can see it go down to the levels as shown in the graph. Lower time frames can be consulted to look for better trading opportunities.