
AAVE is one of the biggest coins in the crypto market currently being ranked at 38 according to market cap. AAVE is a decentralized platform that allows the lending and borrowing of crypto assets. Seeing the price in 3 figures gives an idea of how much the platform is being used and how much traders have interest in the project.
Price History
The coin had its ATH around the price of near $665. After that, the market crashed and the coin attained a value of $172. The market showed a reversal and had its leg up to a price of around $450 and then dropping again to where it is being traded at a price of $281.18 at the time this article was written. The price has dropped about 3.63% in the last 24 hours.
What does the Chart shows?
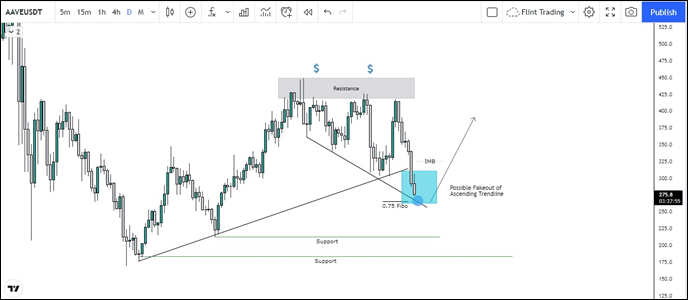
Possible Liquidity, trend lines, support, and resistance zones have been drawn on the chart for AAVE. The resistance zone above at a price of around $420 is a strong one. Every time the price touched that zone, it has dropped hard. As a result, liquidity has been created above this zone (equal highs is a confluence about the liquidity generation). The trendline is also falling and it has been respected by the price at this point as it had shown a relief bounce from this zone. Market might try to create a fakeout to grab the liquidity present above (low chances of this happening because the whole market is bleeding, it doesn’t make sense for AAVE alone to have a significant increase at this time) but it needs more clarification. Imbalance has been created due to the inefficient price action between the zones of $300 and $330 so the market have chances to move towards that area. Even if the fakeout doesn’t happen probable chances are that it may fall down to the recent and nearest strong support (small supports do provide a relief bounce sometimes). Moreover, the trendline also aligns with the 0.75 Fibo level of the rally down, meaning that the zone is strong and helping the coin to stay stable. The lower support is the zone from where the reversal started, If both the trendline and support is broken then it can come back to its price to June’s low. Reversals can be noticed by looking at lower time frames to take possible entries.