Hedera Hashgraph (HBAR) at the time of writing stands at a price of $0.3469 with an increase of 3.53% in the past 24 hours. The coin had created its all time high and touched a value of almost $0.58 (in my opinion the coin is undervalued at this point) a few days back. The last ATH was around $0.458, the price broke that level on 15th and 16th September 2021 and went into price discovery. HBAR is one of those coins that went to its ATH during this corrective wave along with the likes of Sol, Luna, Ada.
HBAR Technical Analysis
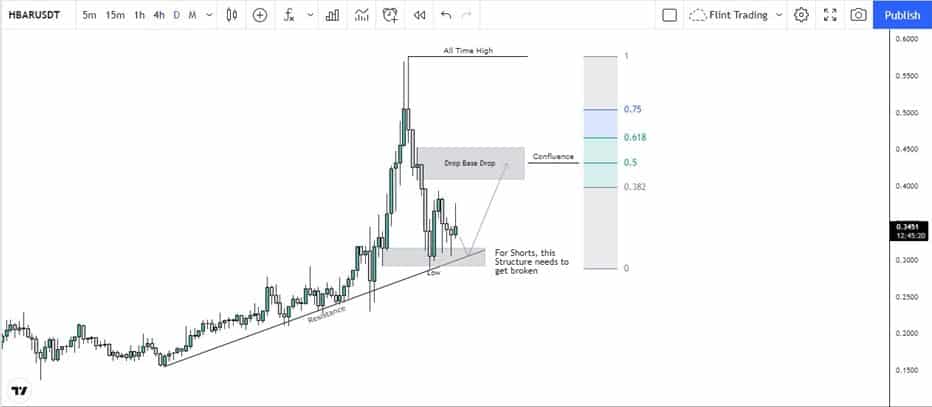
On a daily time frame, nothing much can be seen. It can be noticed that after the ATH, the coin went to retrace the whole movement it showed. The zone shown as Drop Base Drop is an important zone as it also aligns with the Fibo level of 0.5 (showed reaction while dropping and climbing from this level). But this zone didn’t showed the reversal on higher time frames. It was safe at this point.
The point that should be looked at carefully is around $0.289. This structure currently holds the market in an uptrend. The market has showed a bounce from here. If we are to go short then this level is to be broken, that will confirm the reversal of the market. At the moment on HTF no such signs could be seen.
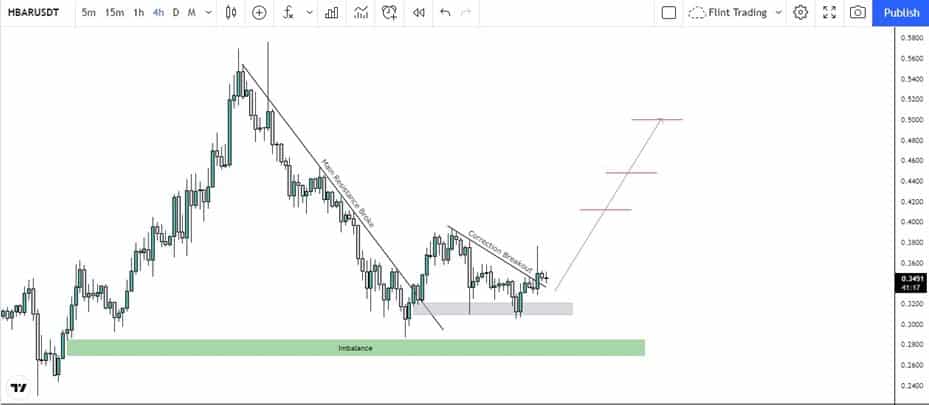
On lower time frames, we get clear ideas how the price is currently reacting. The price had been moving in a downward channel and was clearly respecting the line. The presence of imbalance was a confluence that the market could retrace to this point. The market could have been in the downtrend if it got rejected by the zone but it broke it towards the upside. This confirmed the reversal sign on a somewhat lower time frame. The market went to correct the breakout. As such the higher low wasn’t broken hence it could be said that the trend wasn’t broken. Now again the price had broken the new trend line and it could be expected for the price to touch this line again and bounce from here. Different levels are drawn (arbitrary levels, it varies from person to person for profit taking if the trade was running) such as $0.40, $0.41, $0.42, $0.50.