Different exchange platforms have launched their own native tokens. Binance launched BNB, Kucoin launched KCS, similarly FTX has FTT coin. Being one of the popular exchange platforms in the masses, FTX boasts the 4th most trading volume behind Huobi, OKEx and Binance. The price of FTT is a reflection of it. All of these exchanges provide incentives to its users if they hold native tokens in their exchanges. FTX also provides certain benefits to people who hold FTT.
At the time of writing FTT coin stands at the price of $53.36 with a decrease of 4.39% in the last 24 hours. Overall the monthly time frame of FTT has been good as it had achieved a price of 14.90%. FTT has also achieved its all time high this month where it went to the price of almost $86. FTT had achieved its ATH after it released the news about acquiring Ledger X. FTT is currently ranked at 23 number on coinmarketcap in accordance with its market cap. It has a total dominance of 0.35% equal to that of Filcoin.
FTT Coin Technical Analysis
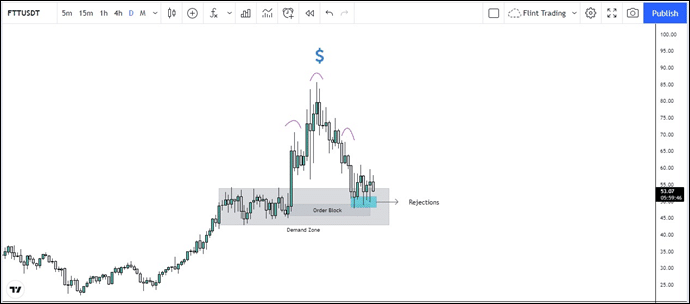
On a daily time frame, the most visible pattern we can see is the formation of a head and shoulder pattern. It is to keep in mind that higher the time frame, stronger the patterns, hence a H & S pattern on Daily Time frame is stronger as compared to the one at hourly TF and weaker than the one at Weekly Time Frame. Before the move towards the upside (before the first shoulder and head was formed), the market was ranging and an order block was formed at that point, market tries to mitigate the order block and that is what it did in this case. The market since then has held support of that zone. If the price is to show any uptrend then holding this zone is very important, losing it would prove it otherwise and the market might retrace back to the bottom.
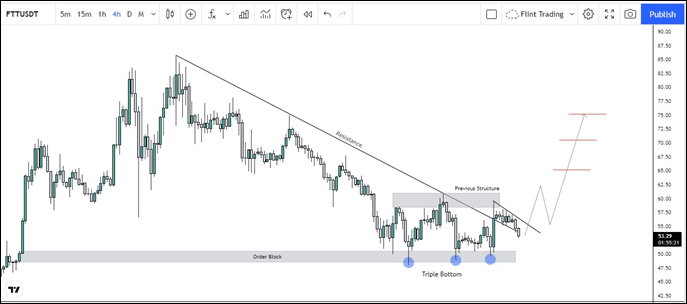
On 4H time frames, price is showing bullish momentum. The market was moving in the down trend channel and then it broke down when it formed a triple bottom at the formation of the order block on the same time frame. As a result the market has broken the trend line is now looking to test it again. If it holds this line then we can expect the market to move up again. Confirmation can be taken by seeing how this candle closes.