
Current and Past movement
At the time of writing Monero (XMR) coin stands at a price of $230.8 with a decrease of 1.45% in a single day currently ranging below the last day’s opening. It reached $244.19 and $228.38 as maximum and minimum today. XMR created its all-time at the price of $519.1 in May 2021 and then dropped down almost 35.46% retracement and almost invalidated the gain it had done during the last month where it had shown a bull move of almost 71.59%. During the same month when it created its ATH, XMR also created its bottom and went to the price of $124.7 from where it showed reversal. This month the price currently stands below the August bottom. XMR stands at 34 position according to its market cap.
Technical Analysis (XMR) Coin
Talking about the current pricing and forecast of XMR, few things are to be discussed and pointed out.
The recent behavior and moves; price on 23rd August 2021, tapped in the supply zone which was a drop base drop area. A rejection could have been expected which happened and to quite an extent.
The market after tapping into that zone, developed quite a bearish momentum that still hasn’t came to an end. The reason was that it was not just the supply zone but a famous pattern i.e double top which formed within that, which got the eyes of sellers to get induced within that.
Now as being in a bearish trend, market has left some imbalance within the move that needs to be filled. On 21st September 2021, market broke previous structure but the next day it came again within the range, which got some liquidity and can be considered as fakeout. As market is still within that range, and the Fibo also aligns with that as well ( golden zone) so a reaction towards upside can be expected. Now for possible longs, if the trendline as being marked is broken and on a proper retest a possible long can be taken.
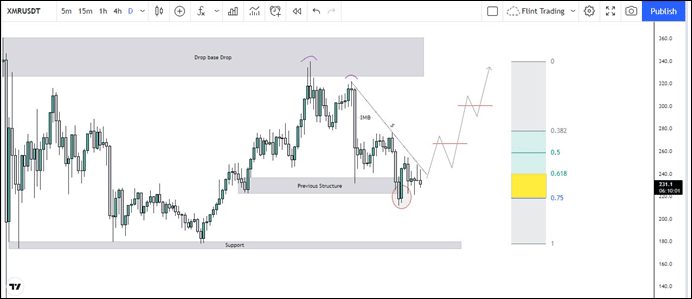
If market follows the plan, the obstacles market can face are at $267 and $300.7 as they are orderblocks which can serve as a reason for sellers to get induced.
Now if this doesn’t get followed and the level of $212.1 gets broken, everything upside will be invalid. and if that does occur, possible targets will be that support zone as many orders are sitting within that.