
The coin had created its All Time High in April and reached a price of almost $6348 before falling down to a price of almost $1829 by losing 75% of its value. At the time of writing this article, MKR is being traded at a price of $2181. The price has dropped almost 38.09% within this month alone completely removing the gains that it had in the last month when it gained 18.41%. Currently, on a daily time frame, a 1.44% decrease in the price is being observed.
MKR Technical Analysis
The market in starting weeks of May made its all time high with quite impulsive moves, after the move was over the market had been in a correction phase. Seeing the chart on the higher time frame, the market is mitigating the candle that spiked down on 23rd May and a supply zone is lying just at the origin of that spiking candle on 18th May. That candle is sometimes referred to as an institutional candle and gives the probability that high buy orders have been triggered at that point. It is likely that the price will be pushed upside to breakeven so that the orders placed there are brought to breakeven in the future.
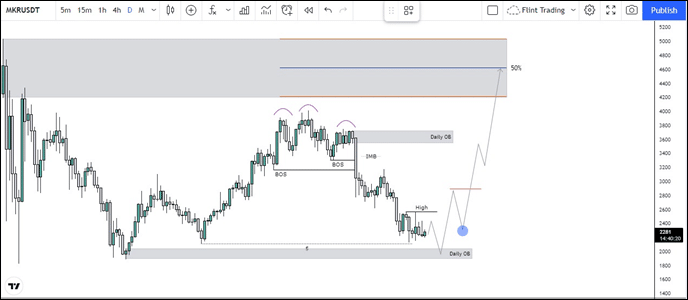
Now the recent price action price is exactly doing the same but in opposite direction, it has induced liquidity and it will soon be taken out and a possible reaction is expected from the daily order block lying below that. As imbalance is present on the upper side, this gives another confluence for the market to go long.
The last thing to confirm the bullish momentum is for price to break the recent high structure and once it does, on retest a possible good entry of long can be taken place.
Now this was a plan for long, in case if the daily order block below the current price doesn’t hold, it is very likely that the major trend might change from bullish to bearish.