
At the time of writing, GRT is being traded at the rate of $0.6469 with an increase of 3.43% within the last 24 hours. The low within this tenure was around $0.6201 and the high was approximately $0.6574. The coin as being in the watchlist of many traders makes it ranking all the way up to number 46 according to the data release by coin market cap.
This coin made its all time high in the month of February 2021 where it reached an enormous amount of $2.8807. Afterwards the market is balancing out the move which made that all time high.
GRT coin works of Ethereum block chain with a daily volume of $73,881,313 with a decrease of 9.97% within the last 24 hours. The market cap of this coin alone is around $3,050,422,992 at the moment which is being forecasted to be much more in few years.
GRT Coin – What does the chart shows?
Talking about the technical part, this coin on monthly time frame made its all time high with 3 bullish candles taking the start from December the 1st. afterwards the market as most of the coins is being in a corrective phase.
On the daily time frame, a slowdown in momentum has being actually observed making sense that price in a bigger picture is in a Wyckoff accumulation schematic, which gives an idea that the bearish trend might soon get exhausted.
On 19th May some huge orders had been placed which is not normal for retail traders to do so, as moving market need huge influx. Seeing this move and imbalance within the candle, much orders have been likely placed there which needs to be mitigated in order for them to get at breakeven.
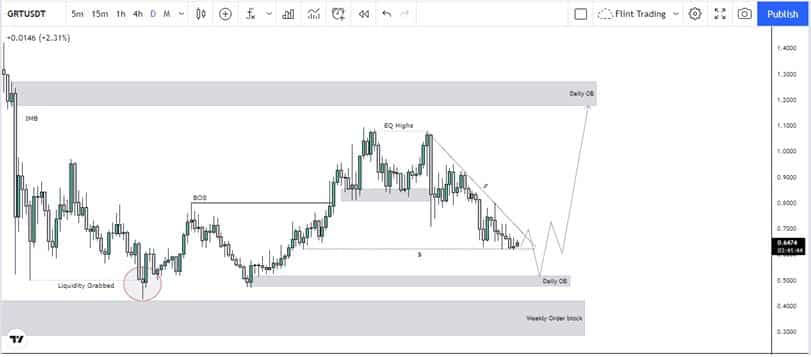
After that move market has been breaking structures to the downside until 22nd June 2021 when it spiked down instead of candle closure below which was merely to stop hunt the reversal traders. Soon after that, market had been pushing again to the upside. Just when the market was about to tap in daily orderblock market created equal highs/double top which caused the market to fall and made the price to do a complex Elliot pullback of the recent bullish impulsive. Now this double top must have induced a large number of sellers within the market which the price might target for future.
The market as being corrective was really efficient and there were no gaps within it giving out no reason for price to reject in future.
Now the recent price action is quite impressive and very clear as the market being respecting the descending trendline and creating liquidity both to the top side and downside by making a possible support area. This soon seems to be take out which will leave the price to go into the daily orderblock present at $0.5213 and a possible entry can be observed if proper market structure shifts gets observed. If these aren’t observed and price breaks this zone, it is likely that price might react from the weekly orderblock sitting below this.