
Enjin is a project that provides blockchain-based gaming products. Enjin Coin was first announced in July 2017 and it was launched on the Ethereum mainnet in June 2018.
This coin is being traded at the rate of $1.48 with an increase of 11.62% in the last 24 hours. About 80 percent of the max supply is circulating in the market at the moment which is around 834,340,659.57 ENJ.
ENJ made its All-Time High very aggressively in the month of April reaching a value of $4.000. Talking About this month, ENJ increased with a percentage of around 13.38%. This coin is ranked on number 81 at the moment according to the coin market cap data. The daily traded volume has reached a figure of around $105,734,216 with an increase of 36% in the last 24 hours.
Technical Analysis ENJIN (ENJ):
Just like many coins, ENJ is also in a corrective phase in the monthly time frame. It’s more kind of making a pennant pattern on monthly time frame giving out nothing clear bias on monthly but as being the market being in bullish correction, the bias can be considered as bullish.
Jumping on the daily time frame, the price is showing bullish evidences as well. Now keeping in mind that recently bitcoin rallied up quite momentously moving 3000$ in just 1 hour, so this confluence of Bitcoin on every other alt will affect this coin as well. So as being the monthly bias and confluence of BTC to buy as well, only buys will be preferred.
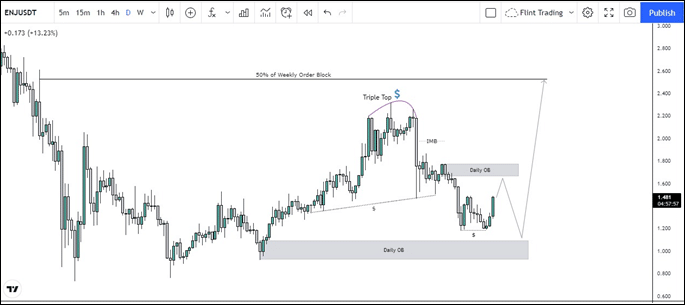
On a daily a clear shift in trend can be observed which occurred on 23rd August 2021 indicating that sellers seems to have been exhausted in this corrective move. After that the structure shift happened, the market did a complex pullback after forming triple tops. Now sellers have been induced into that for sure, leaving above liquidity which will be a target for the market in the future. Now within this complex pullback, the market created liquidity and eventually grabbed it. Now this pullback has to have an end soon which price now seems to have been showing. If we have a closer look, the market did make a double bottom triggering pattern for traders to jump in. Now ideally this momentum might last till the daily order block sitting at $1.666 from where a bearish move can be considered which might take out the double bottom liquidity and from there a momentous move can be expected. Now if price plays according and fall in the phase of the original move, there are few areas which can act as resistance for the price to clear that triple top liquidity. Firstly the imbalance zone within the candle of 7th September 2021. Secondly market might show some rejection from the triple top just to confuse support and resistance holders to fall for their trap for shorts. Now this plan have chances of being followed if the order block at $1.096 holds the price and if does not, the price is likely to fall to $0.583 in which an order block is lying which might get mitigated by the price.