Price Movement
The coin had created its All Time High on 23rd September and reached a price of almost $79.80 before falling down to a price of almost $61.26 by losing 95% of its value. At the time of writing this article AVAX is being traded at a price of $64.77 with a decrease of 0.40% in the last 24 hours. A good pump before the start of Q4. The price has been continuously printing green candles for the past 3 months and has shown gains of 13.19%, 192.05%, 68.68% respectively. Since the reversal the price has shown incredible run and gave amazing returns. In the past 24 hours the volume has decreased by 19.26%.
The circulating supply is around 220M AVAX. It is listed at 13th on coinmarketcap with a dominance of 0.64%
AVAX Technical Analysis
The market has had an amazing run in the past and this month the price reached its ATH. As such the price is due to retrace to have a healthy movement towards the upside. A lot of confluences that the price can drop down to lower levels.
The Elliot wave pattern (ABCDE) has been completed and as such is acting as a confluence to the drop of the price. We can see that the rising pattern broke down below which also confirmed that the price had broken down to create lows. But at the moment reversal hasn’t been confirmed as the structure hasn’t broken as denoted by “low” in the chart.
Looking even below we see that the price has had an impulsive move towards the upside. Whenever market moves in such a way it creates imbalance in the way. These are shown by the inefficient movement of the candles with no mitigation to those zones.
If the presence of liquidity isn’t enough then we can also see the presence of a daily orderblock. It has been seen that the market retraces back to those levels and mitigates it.
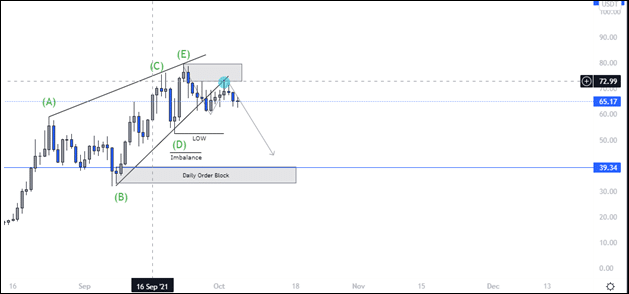
All these are confluences of the fact that the market is due to retrace but one thing to notice is that for this scenario to open the structure is to be broken which would then eventually confirm the retracement of the price to lower levels.
In case that the level isn’t broken then it means that the price isn’t retracing at the moment and it will continue to move upwards and touch the ATH again.