KCS Technical Analysis:
The directional bias of KCS is not too visible at the moment as the coin is in the middle of range from where it has potential to go both towards upside and downside but will be jumping on the confluences on each side that which things can cause and drive the price to either direction.
The price after making its All Time High started doing correction of the bullish wave which created the All Time High. Observing the price on a higher time frame i.e. Weekly or Monthly the price seems to be now in a consolidation giving no direction to be precise. But talking about the recent price action, the market has been creating liquidity for a while. From 19th of May to 22nd of June market created double bottom and a lot of liquidity was left below that which can be a target for price in the future.
After the completion of double top price rallied up quite strongly which broke structure to the upside creating an origin of demand zone and leaving inefficiency within the candles of 5th and 6th of July. This imbalance was soon fill by the price but while filling it market again created trendline liquidity while moving upside.
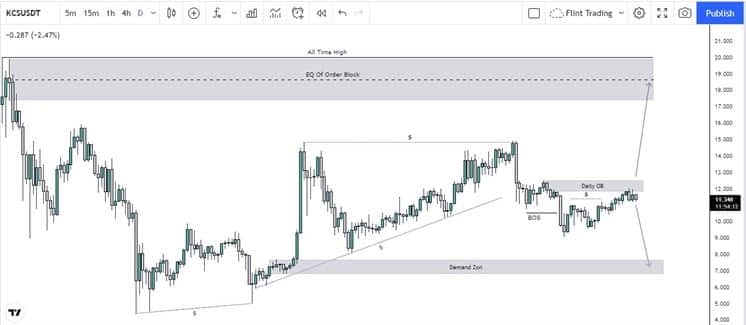
Now talking about the most recent price action, the price seems to be around an order block which is sitting from $11.858 to $12.540. Just before this return to orderblock market did created liquidity and grabbed that as well, giving more sense that this orderblock might hold and push price downside. merging previous confluences which were discussed i.e. liquidity and demand zone, it is likely that price might cover the area to the downside and eventually grab liquidity before continuing up.
Now as mentioned above there are confluences to both side which can drag price to either side, so price does have the potential to the upside as well, as there’s liquidity present which is lying above the equal highs as it can be seen in the chart. so many buyers must have been induced within that which might soon be taken out.
And in case if the current order block doesn’t hold, and demand overtake the supply, it is likely that the price will continue to mitigate the equilibrium of the orderblock which is present at $18.641.
Current Price Movement
Kcs being one of the coins that is still stable when Bitcoin was falling is struggling to rally up. This coin being traded at the rate of $11.27 has extremely potential in the future. The circulating supply is almost now half of the max supply which is around $80,118,638.00 KCS.
The coin has a decrease of 4.54% within the last 24 hours. Talking about this month, KCS actually increased around 12.01%. similarly previous month i.e. September, it lost around 24.03% of its value. This coin is ranked at number 103 at the moment according to the coin market cap data.