
As having almost the same codebase as Polkadot, Kusama (KSM) coin is considered as the wild cousin of Polkadot.
Dr Gavin Wood who as the founder of Polkadot also founded this project. This and some worthy things makes this coin ranking all the way up to 52 according to the record and database of coinmarketcap. This coin is currently being traded at the rate of $322.63 with a decrease of around 3.28% within the last 24 hours. The recent low was around $307.02 and the high was around $333.91.
Price Movement
The price made its All time High on 18th of May 2021, where this coin price surpassed $600 and reached a figure of approximately $625.
After having an increase of 100% in the month of August the coin is showing weakness and decreased around 18% after that till date.
The total Volume Traded currently is around $121,010,450 with an increase of 13.62% within the last 24 hours. The circulating supply is almost equal to max supply which is around now 8,470,098.06 KSM coin.
KSM Coin – Technical Analysis:
KSM coin after making Its all time high went is the phase of correction that led the price to push to $144. Afterwards the price has shifted the structures to the upside making the correction to be over and shifting the trend from bearish to bullish.
Once the price reached the orderblock which was present around $385, the price reacted from it and gave some confluences to fell down for some time. As soon as it did, a break of structure to the downside was observed which gave an indication that the current orderblock might be strong and can might held the price from going upside.
Now talking about the price action, what is it showing and what to expect.
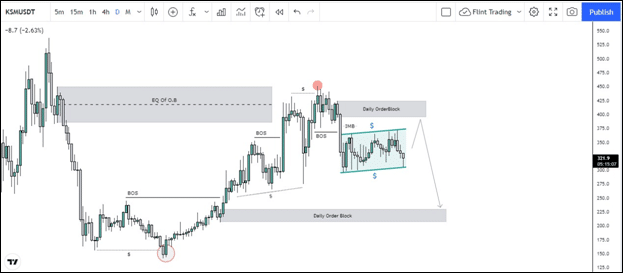
Now if this does, the same but opposite reasons can drive the price lower as well, as there is quite much of trendline liquidity below and just below that a daily orderblock is laying which may drive the price to the downside later on.