
Price Movement
Nem (XEM) being ranked at number 71 according to coinmarketcap data is being traded at around $0.17 at the moment. The coin has a decrease of almost 3.67% within the last 24 hours. The high within this the price reached was $0.18 and the low was marked at $0.1674.
XEM is a native currency of NEM’s NIS1 public blockchain. The coin has a trading volume of around $81,098,033 with a decrease of almost 36% in the last 24hours. The Circulating supply is now equal to the max supply which is 9.00B XEM
Xem reached its all time high back in March where it gained a figure of $0.8757 and afterwards the price has retraced back fully as BTC confluence over this coin was pretty strong. This month an increase of 16% has been observed and is expected to increase further in the coming months.
XEM Technical Analysis:
The price of Xem is quite bearish on the monthly Timeframe. as it has properly engulfed the wave which made the all time high of this coin.
Now the recent moves seems to show Wyckoff accumulation schematic which shows that price now seems to have potential to the upside.
Talking about the price action, the market while pushing down was breaking structures to the downside but on 22nd June it wicked and afterwards the price started breaking structures to the upside and that could have been considered as a structure shift.
This bullish move left an orderblock which recently price reacted from which is around $0.1355. Price tapped into this and a bullish move was observed which broke structure.
Now the things which can drive the price to the upside are liquidity which is present at $0.1942, and just above that imbalance and orderblock is present which may cause the price to tap into those in the coming future.
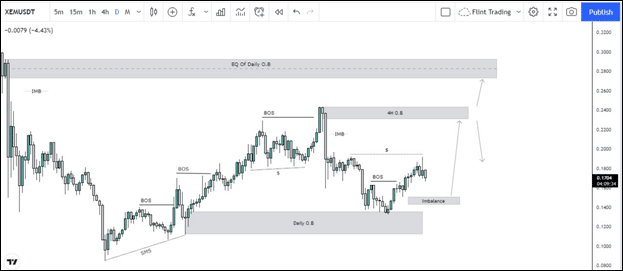
As mentioned the orderblock which can drive the price to the upside is present at $0.2313, this institutional candle emerged a strong bearish move which shows that a lot of orders and positions are unmitigated and those need to be filled.
Talking about the entry, it is not ideal and neither much risky at the moment if there are lower time frame confirmations, but if being conservative, the ideal entry will be from the fair value gap/ imbalance present below.
Now if the price doesn’t respect this and continue to break the imbalance and orderblock zone, it is very likely that the price might reach a value of $0.0813.
Talking about the targets the 4H order block at $0.2308 is quite reliable as the price might react from it either to the downside and to the upside which will get confirm depending how the price delivers within that zone.