
Technical Analysis:
Bitcoin has just recovered from the correction wave which was balancing out the impulsive move which created the new all-time high of Bitcoin. The correction is very visible on the monthly time frame, and it can be seen that these sorts of move are very common and healthy for the market.
The price of Bitcoin was in correction wave i.e. bearish till 20th of July and afterwards a shift of market structure was observed which totally induced buyers within the market that made the price to return from $29286.52 to a value of $57838.18.
The market had showed several reasons to continue to the upside while its way to the upside. In its way, it created a pole flag pattern which unfolded beautifully. The recent move which got Bitcoin near to its all-time high was the expansion portion of the pole flag pattern. Within the price, the price created liquidity which was grabbed which kept BTC flow to the upside very normal.
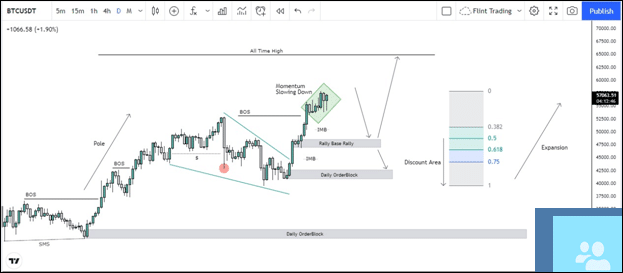
In addition, as mentioned before about pole flag pattern, the market has totally expanded of how much the pole was. this gives an indication that the market might reverse sooner or later to mitigate the areas below.
As the market in expansion, its above the equilibrium which only recommends to short for now. Now there are some footprints left behind which can drive the price to the downside as well, which are imbalance present at two different positions as the market in the chart. and just below each one of them, there are demand zones which can induce buyers within the price and might result in a push to the upside.
Now either market might reverse from rally base rally pattern or if that doesn’t hold, its likely that price might fill below orderblock which might push price away.
As the last low present below the orderblock, if these both 2 zones doesn’t hold, the buy bias will be weakened, and ideally, shorts would be preferred.
Bitcoin Current Movement
At the time of writing, BTC is being traded at the price of around $57k. The market has been overall bullish and large caps are gaining as well.