Yearn Finance native coin (YFI) is a quite volatile coin in regards to its sudden and huge changes in momentum and volume.
The price action on a daily time frame is quite beautiful, but before jumping to that, let us talk about weekly and monthly time frames, to get an idea of the bigger picture. The price on monthly seems to have been correctively pushing upside. No clear imbalance among buyers and sellers have been observed. Moving down to a weekly, change of perspective can be observed as the market previously was breaking structure to the upside but recently it broke structure to the downside.

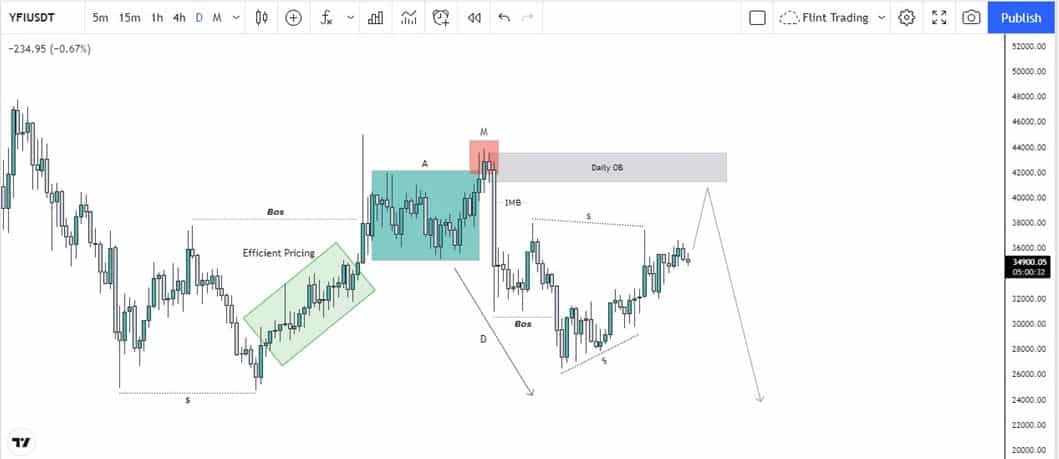
Now jumping to the recent price action on the daily time frame, it can be seen that in between 21 June 2021 to 22 July 2021, the price created equal lows i.e. double bottom which has left much liquidity below that. That liquidity hasn’t been grabbed by the price till now and it seems sooner it will get grabbed.
After those equal lows, the price moved up with efficient pricing, broke structure to the upside, and started Accumulating
Now an AMD i.e. Accumulation, manipulation, and distribution pattern can be seen here. just after that manipulation, the price fell down way much momentously. and whenever it does like that, it is very probable that it will leave some sort of imbalance within the price which it did in this case as well.
After that price never till now fill that imbalance and started breaking to the downside. recently price tried to come up to fill the imbalance and mitigate the daily orderblock but it failed and started falling after creating a double top. this shows how price is being manipulated and how liquidity is being induced. This soon might be grabbed eventually tapping in the imbalance zone of daily orderblock and from there a push to the downside can be expected.
Current Price Movement
At the time of writing YFI is being traded at the price of $33,901. The price has dropped down by 3.33% in the past 24 hours. The volume has increased by 13.25% in the past 24 hours to reach a value of $186,417,801. October has proven quite good for all the coins as well including YFI. Q4 has had a good start for the market. In the past, it has been seen that October has been mostly bullish for the prices.
Still, the month is going to close in a few days. All we can do is wait and watch.


