
dYdX Technical analysis:
The price action of dydx is quite brilliant and it is showing huge potential in its early stages. Just within the current and previous months, an enormous increase of more than 100% has been observed.
The market without any deeper pullback has been rallying to the upside which usually is not healthy. The price has extended quite much and a need for a retest or correction is a must in order for the price to continue rallying like this.
The price along its way towards upside left inefficiency within the price which may drive the price lower in the future. This imbalance was present in 26 September candle and just before that formed the demand zone from where a large number of orders were placed.
Now these both can cause the price to fall in the future. Talking about the recent price action now, the market seems to have changed the structure to the downside on 30 September as the structure was broken to the downside.
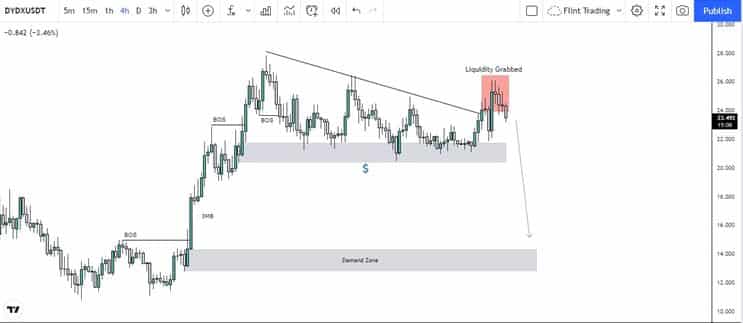
Afterwards the market seems to be in an accumulation phase for quite a period. Now it seems that the market is presenting with an AMD pattern. The accumulation and manipulation phase seems to have been over. Now as per the pattern distribution is expected which most likely will take place to the downside. As btc dominance is getting increased, the alts are losing a percentage, so it is likely that with all these confluences the price may fall till the below demand zone as mentioned above.
Now not to forgot about liquidity which is below the support area present from $21.731 to $20.485. This liquidity may soon be taken out and may play as a confluence for short.
In case if support zone holds and acts as a barrier for price to continue up, the price may rally again upside which would result in a pole flag expansion pattern. This expansion may be equal or around to the impulsive move which started from 25th September to 20th September.
Price Movement
The coin dydx is ranked on number 84 according to coin market cap data. The daily volume at the time of writing is almost $613,686,398 with a decrease of almost 43.86% within the last 24hours. It has a circulating supply of 56,337,466.00 DYDX coins. The coin had created its All-Time High in September 2021 and reached a price of almost $28.857. At the time of writing this article waves is being traded at a price of $21.40 The price has dropped almost 8.74% within this month alone removing the gains to some extent that it had in the last month when it gained more than 60%. Currently, on a daily time frame, 14.14% decrease in the price is being observed. The top exchanges for trading in Waves are currently Binance, Huobi Global, Mandala Exchange, OKEx, and FTX