At the time of writing ICX is being traded at the rate of $2.043 with a decrease of 0.10% within the last 24 hours.
The low within this tenure was around $1.947 and high was approximately $2.159. The coin as being in the watchlist of many traders makes it ranking all the way up to number 78 according to the latest data release by coin market cap. This coin made its all time high in the month of March 2021, where it reached an enormous amount of $3.209
The coin has a daily volume of $143,981,859 with an increase of almost 316% within the last 24 hours The coin at the moment is extremely bullish after its correction.
The top exchanges for trading in ICON are currently Binance, Huobi Global, Mandala Exchange, OKEx, and CoinTiger.
Technical Analysis:
ICX has been extremely bullish for the last 4 months which increased the price worth by 110%.
The price as usual coins has recovered from the correction which took place after all time high. Normally coins take time to cover up what they have decreased in a bullish correction, but this coin had much momentum which allowed it to soon come near its all time high value.
Talking about the price action, the price on 19th of July shifted its structure to the upside which originated quite a healthy corrective and efficient move to the upside. This move filled imbalance, tapped and reacted from the orderblock and even grabbed liquidity.
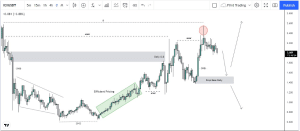
Now recently price as mentioned again did a stop hunt of liquidity which was present around $2.257 and $2.339 and it spiked to the upside grabbing all of it almost. This has made a pattern which is known as turtle soup pattern. As soon as it spiked up, momentum of bulls seems to have been lost and bears seems to have been entered within the market.
Now as there’s imbalance present below, that can cause the price to move downside and fill that, and moreover just below that, a demand pattern i.e. drop base rally is present which needs to be mitigated by the price as well
Now at the moment price is short term bearish till that demand zone. but once if taps within that, there’s a possibility of upside and downside movement, This will be confirmed as how price delivers within that range and which confirmations price shows on the lower time frame.