VeChain is a blockchain supply chain platform. VeChain aims to distribute distributed governance and IOT’s among masses to solve major supply chain problems. VET has tapped an industry that has a lot of potential fundamentally. The platform uses VET and VTHO as tokens to handle itself.
What is VeChain price action?
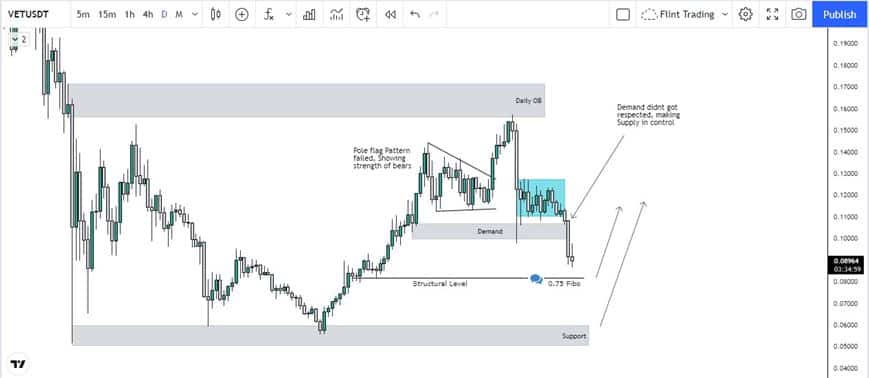
At the time of writing, VET stands at a price of $0.086 with a drop of 6.61% with an overall drop of 25% in a month.
The Past movement
VET has created its all time high on 17th April 2021 and achieved a price of $0.27. After the market crash VET attained a price of near $0.05. This happened when BTC dropped down to $29k. The second time it dropped down again to the same price range when Btc again dropped down to $29k. From here the market showed a reversal of the price and went on to create a next leg up to $0.14. This was an increase of the price by about 3 times.
What to expect now?
The last leg up was from $0.115 to $0.156. An order block was created at a price of $0.09. Market nearly retraced back to this zone when this leg happened. The price had shown a bounce from this zone. After that, it consolidated. But this didn’t last long and the price broke down from that level. This happened when the demand zone wasn’t strong enough and hence the supply took control. It was to be expected as before a pole flag pattern was forming (a pattern that is a bullish sign) but the pattern failed showing that the bears were gaining strength. Now as the pattern failed, the price is going down. An important level is a structural level. A level that the price formed when it broke out of the downtrend. This holds importance as this was the confluence for the market reversal sign and also the start of the exponential move before. This is a zone where the price is currently at. Now the market is at this point and it may show a reversal sign at this point. If this level doesn’t hold then the price can drop down to the strong zone of $0.05 that practically means a drop of more than 35%. Reversals should be noticed to understand how market at both of these level s going to react.